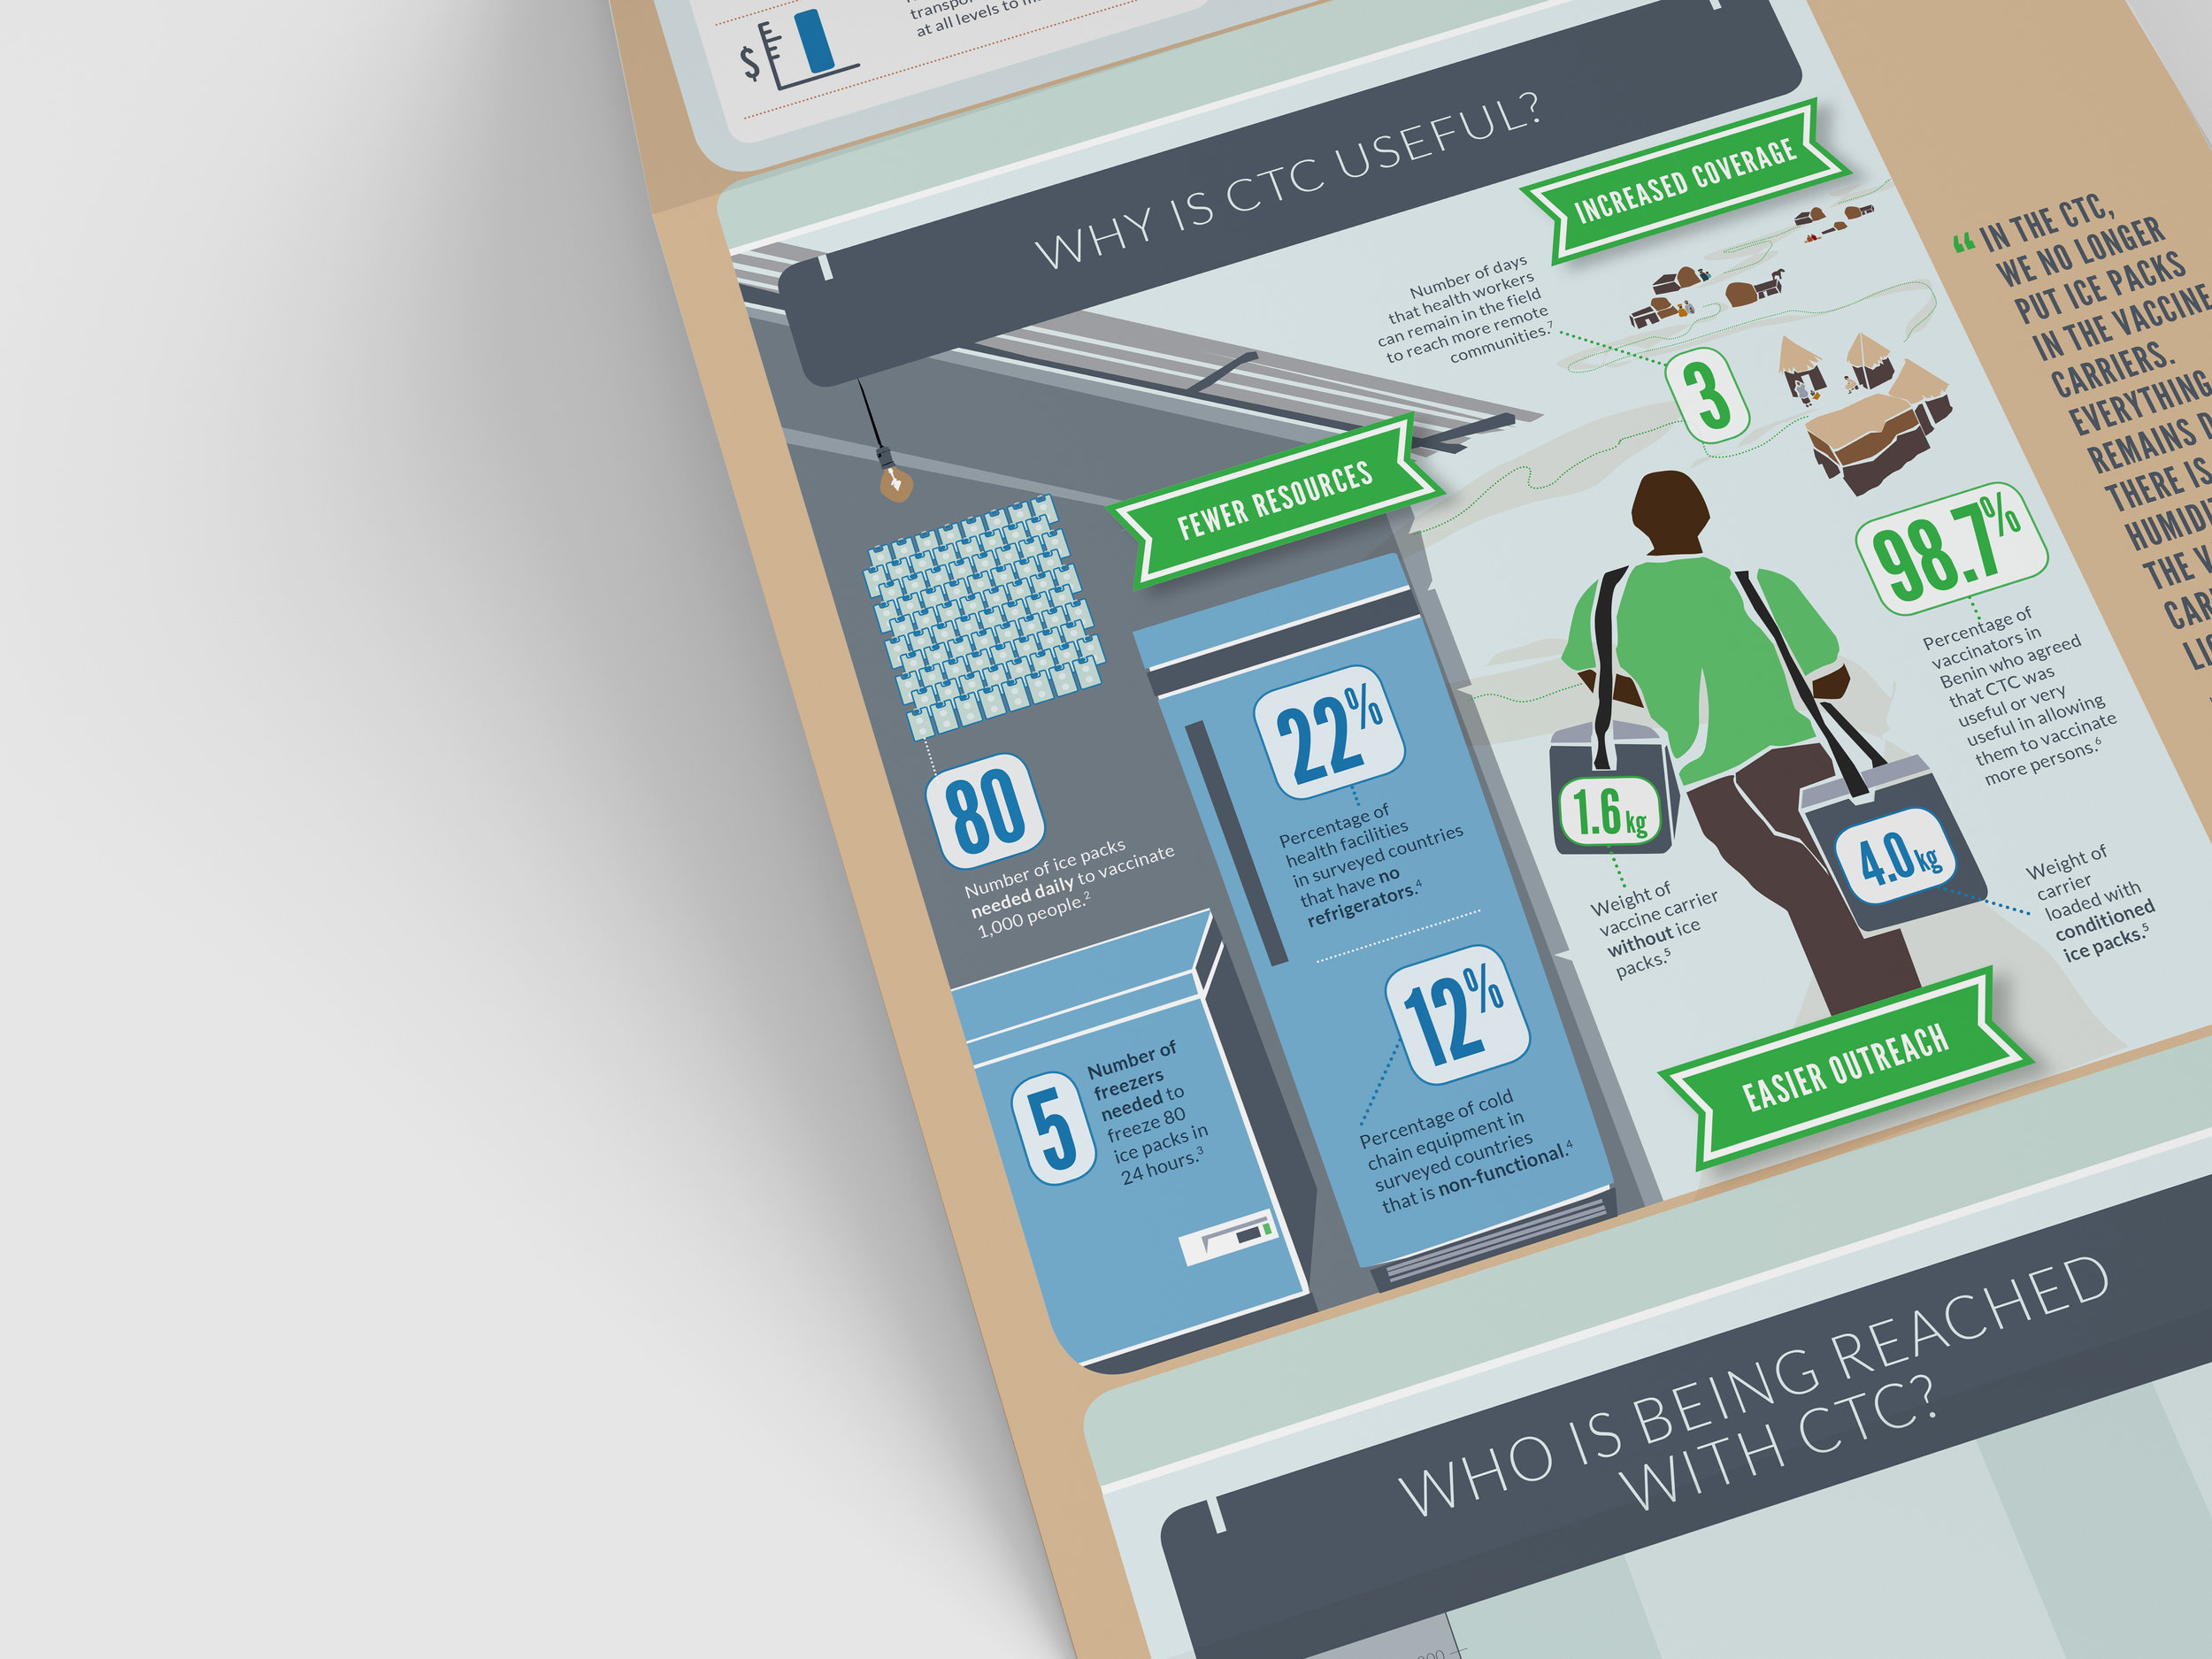


Clarifying complexity.
Infographics are powerful tools. An impressive amount of data can be compressed into these easy-to-follow and engaging tools. Creating an infographic requires a highly collaborative working process as written content and visuals are tightly interwoven.
THESE LOOK INCREDIBLE. WHEN I THINK BACK TO THE FIRST MEETING TO DISCUSS THIS…DEFINITELY WOULD NOT HAVE GUESSed THAT THIS WOULD BE THE FINAL PRODUCT.
COLOR ME INCREDIBLY HAPPY!
— Jason Walton, Director of Implementation and Operations, Global Health Programs, PATH
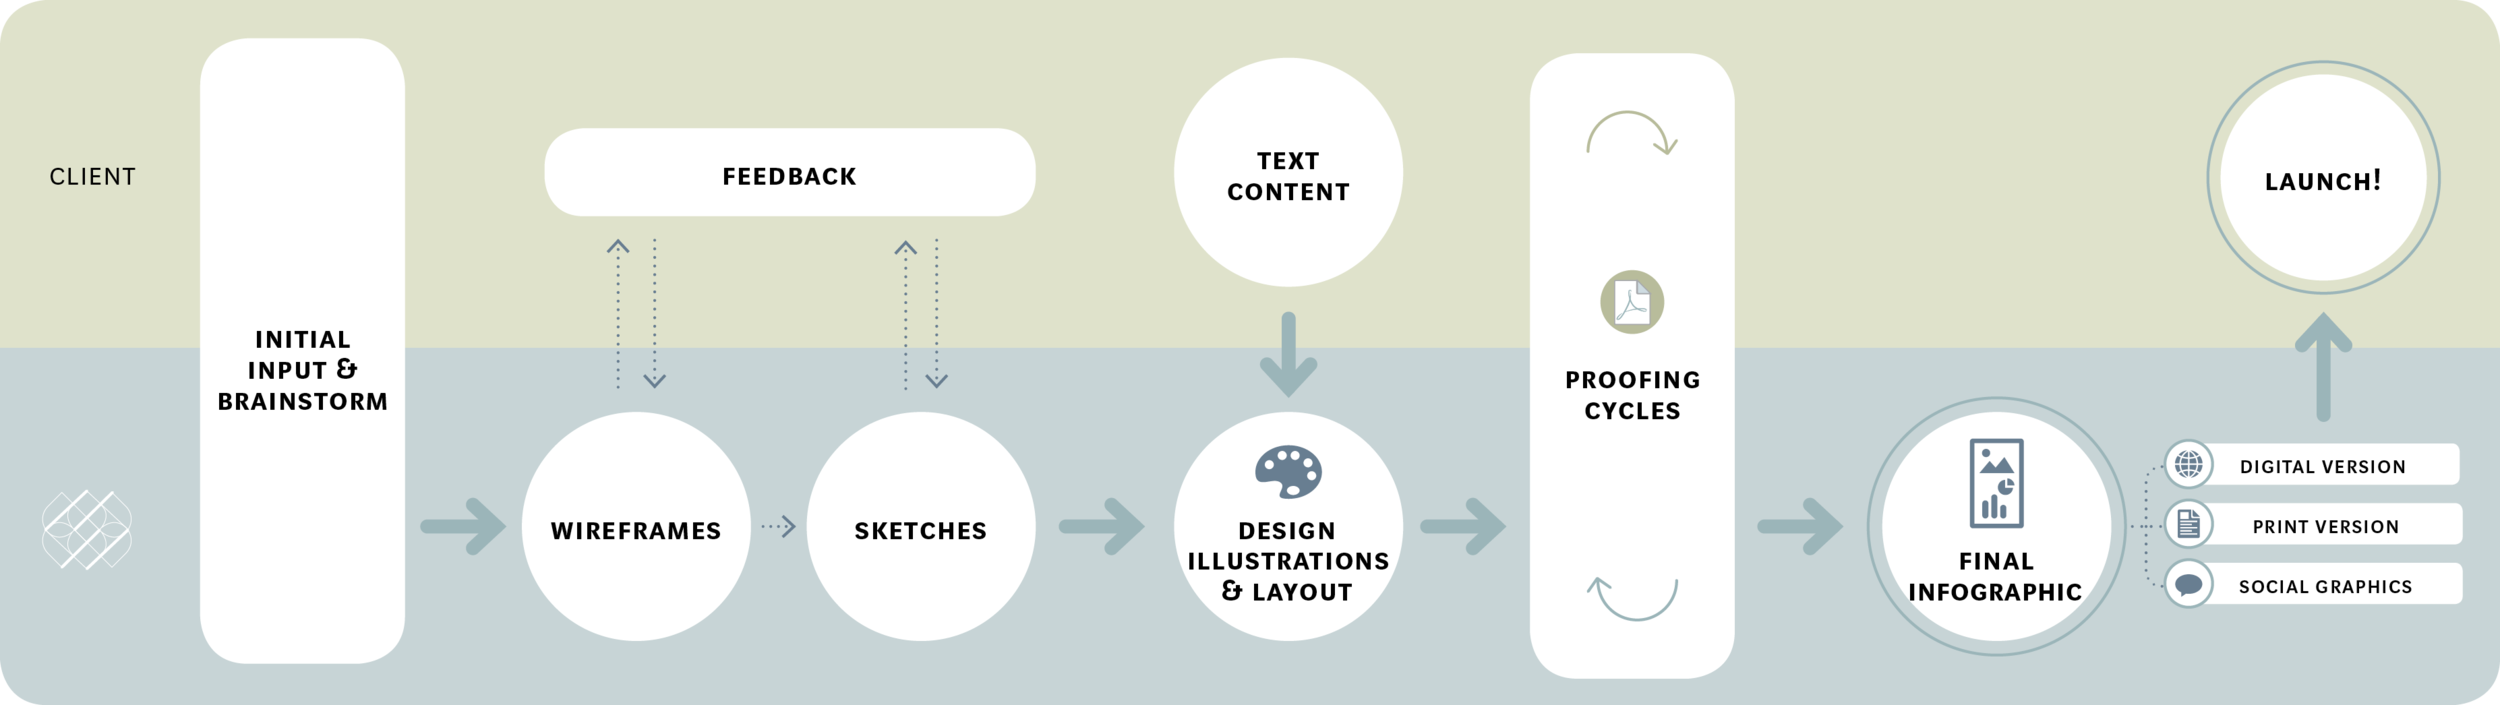
The process
The process begins with an intake meeting. Often, a client will have an outline or framework for what needs to be covered in the graphic. Other times, we will discuss broad themes. Based on this initial input we will sketch out some potential directions. We iterate in the wireframe stage and work together to map out the key sections and content. Once we have the base structure, we will begin illustration and design while the client team works on refining the content. When the text is final, we finalize the layout and proof for consistency and flow.
Once approved, we generate a complete set of files for disseminating the infographic. This typically includes digital and print versions and in some cases, components of the graphic are exported to drop into presentations or to use in social media channels.